Every year we publish the web numbers that matter for business owners. The ones that connect to revenue, rankings, and where your next buyer comes from. Not the numbers a developer cares about. The ones you can act on. The 2026 edition reflects some sharp shifts driven by AI, mobile behavior, and how search itself has changed this year.
The gap between businesses with optimized websites and those without has widened sharply in the last two years. A slow or outdated website used to be a minor disadvantage. In 2026 it costs leads and rankings directly, and most owners do not spot the drag until their numbers have already softened. The data below makes the case.
Mobile Traffic Has Reached a Tipping Point
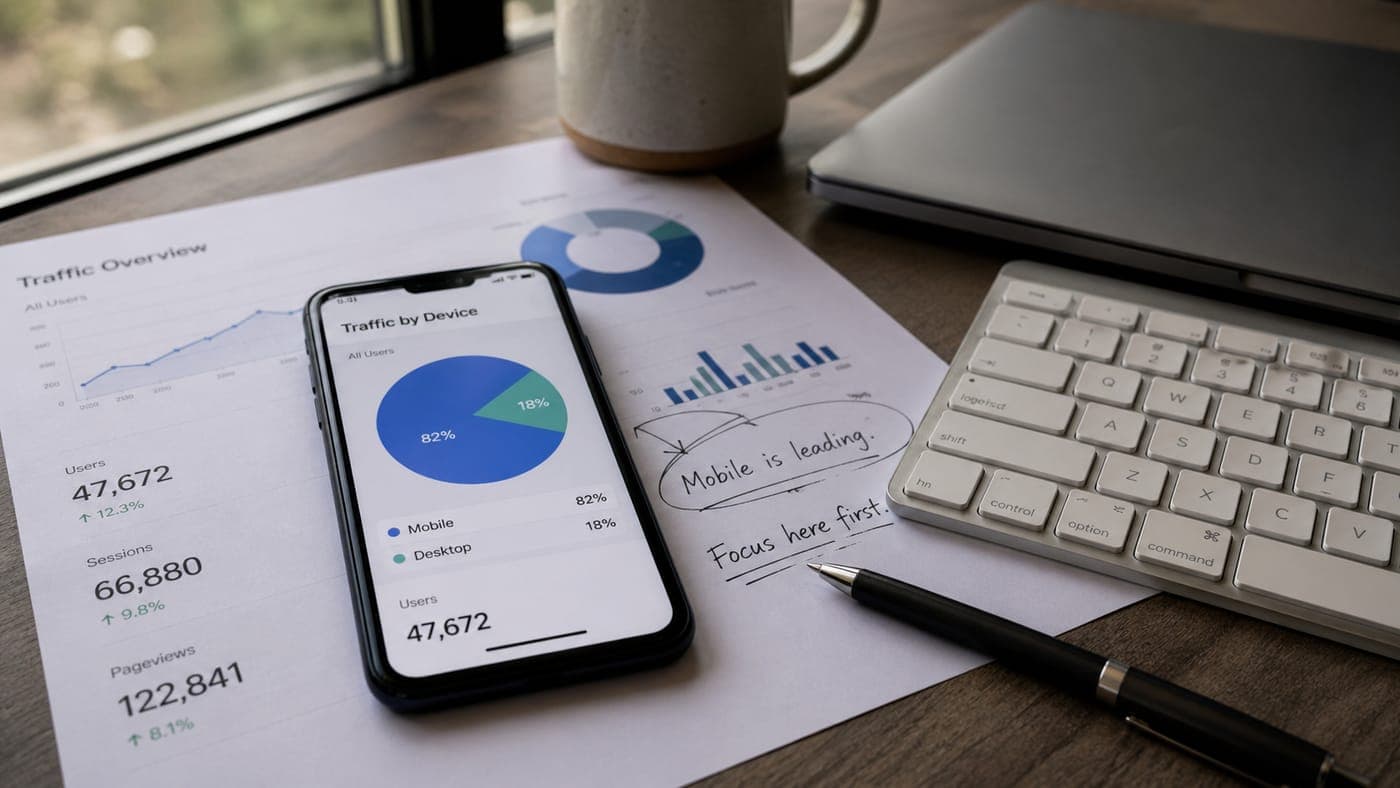
Mobile traffic now exceeds 63% of all web traffic worldwide.
Mobile crossed 60 percent globally in late 2025 and kept climbing. In the United States, mobile is roughly 58 percent of web traffic, and the desktop gap narrows every quarter. Restaurant and retail sites routinely run well past two-thirds mobile. Even B2B industrial verticals that used to be desktop-first have climbed into the 40s. If you are serving local customers or anyone on the move, desktop is no longer the default view of your site.
Better phones are part of the shift. Behavior is the bigger driver. Millennials and Gen Z professionals do not switch to a desktop to research vendors. They do it on a phone during a commute, between meetings, or in front of the TV at night. If your site does not handle mobile well, the qualified buyers who made the effort to investigate bounce back to the search result and try the next name on the list.
Key Takeaway
If you have not tested your site on a real phone in the past ninety days, do it today. Not a desktop browser resized to a small window. Use an actual phone on a cellular connection and walk through every page the way a customer would.
Page Speed Costs You Money
Page speed has mattered for years. What's changed is that studies now put a dollar figure on it. A slow site costs you real sales, and the numbers are public.
2.5 sec
How fast the main part of your page has to load before Google calls it slow. Over 4 seconds is a failing grade.
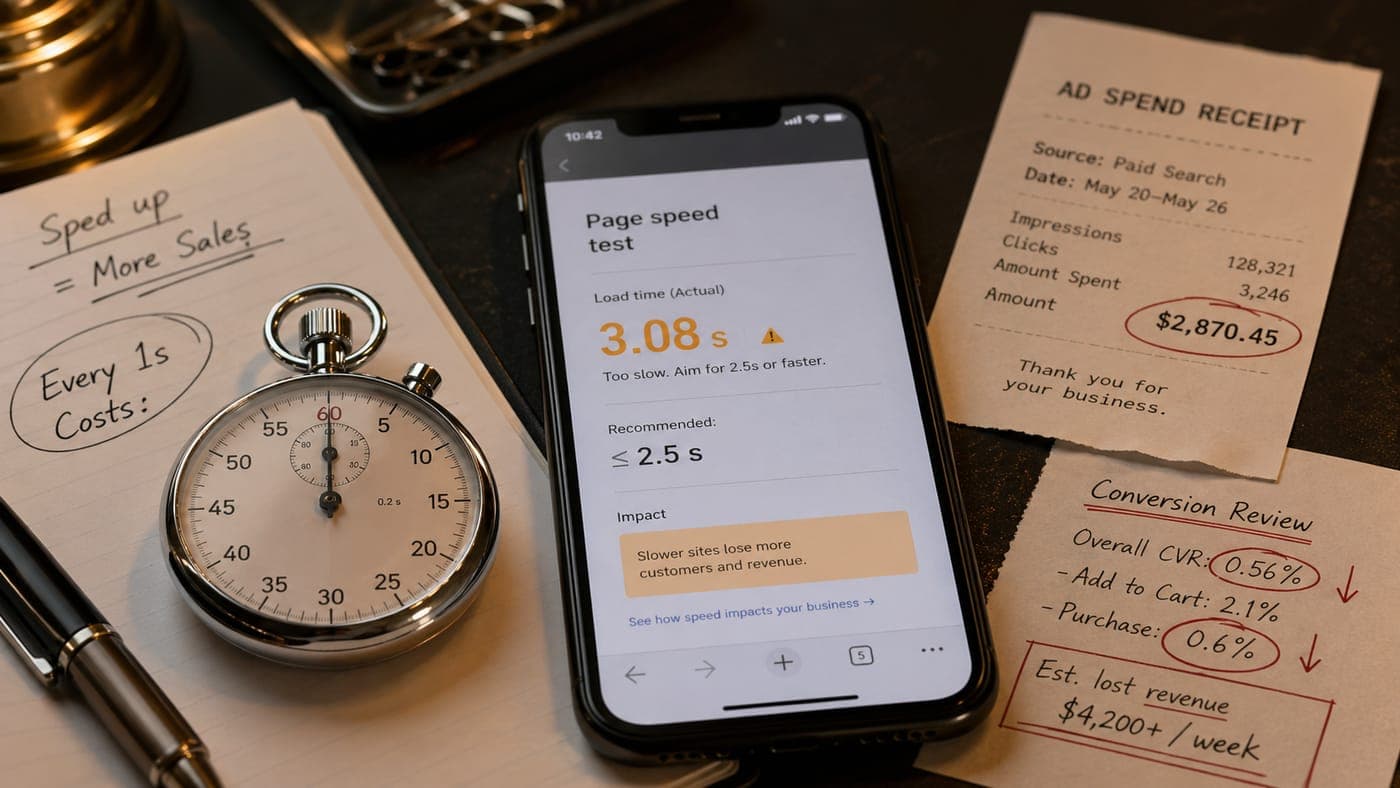
2.5 seconds is Google's threshold for a passing Core Web Vitals score.
Portent's site speed research found that a site loading in one second sells roughly three times more than one loading in five. Google and Deloitte's Milliseconds Make Millions study found every one-tenth of a second faster produced an 8.4 percent jump in sales and a 9.2 percent jump in order size. Same traffic, same pricing, same products. The only thing that changed was how fast the page came up.
53%
of mobile visits are abandoned when pages take longer than three seconds to load.
The abandonment curve is steep and it gets steeper with each added second. Google's DoubleClick research found bounce probability rises 32 percent as load time goes from one to three seconds, 90 percent from one to five seconds, and 123 percent from one to ten. Every tenth of a second matters because your visitor is measuring your site against every other site they used today, and their patience is short.
There is a business implication here. Spending on advertising to drive traffic to a slow site means paying to bring people to an experience that turns them away. We tell clients that running ads to a slow site is like paying for a billboard that directs people to a store with a locked door. The money is wasted until the site itself is fixed.
Spending money on ads before fixing site speed is like paying for a billboard that directs people to a store with a locked door.
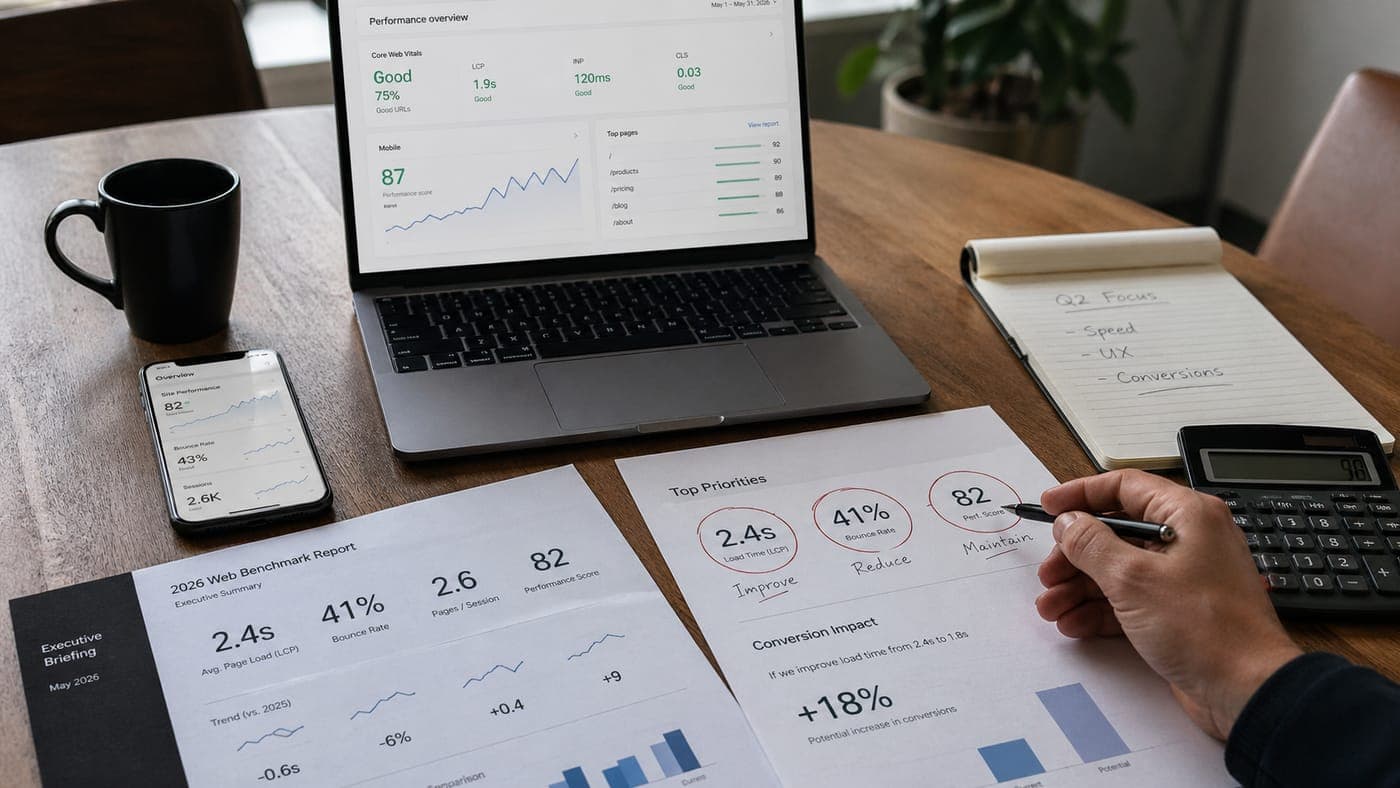
How Google Actually Grades Your Website
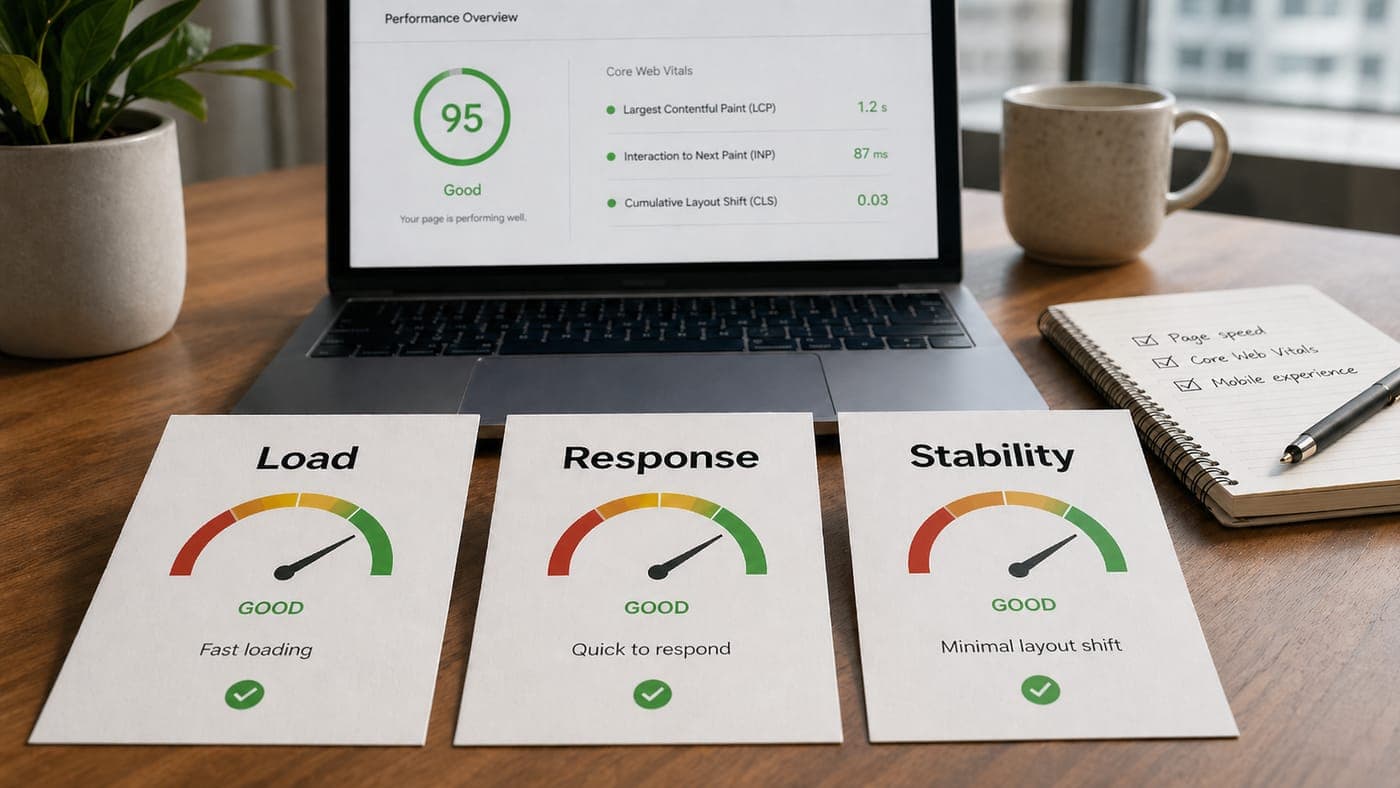
Core Web Vitals directly influence your search rankings.
Google grades every website on three things: how fast it loads, how fast it responds when someone clicks, and how much the page jumps around while loading. Google calls these Core Web Vitals. In 2026 they directly affect your search ranking, and Google raised the bar this year.
Under 2.5 seconds
How fast the main part of your page needs to appear. Under 2.5 seconds is good. Over 4 seconds is a failing grade from Google.
The first measure is how long it takes for the biggest thing on your page (usually the top image or main headline) to show up. This is what people are reacting to when they say a site feels fast or slow. Vodafone's page-speed case study found that a 31 percent improvement here produced an 8 percent jump in sales and an 11 percent jump in cart-to-visit rate.
Under 0.2 seconds
How fast the site has to respond when someone taps a button or clicks a link. Over half a second feels broken.
The second measure is how fast the site responds when someone taps or clicks. Users tap a button and nothing happens for half a second. They click a menu and it takes a visible beat to open. Each of those small lags adds up, and users leave. A site can load fast and still fail this test. WordPress sites with a stack of plugins fail it most often.
Barely moves
How much the page can jump around while it loads. The benchmark is 'barely moves.' If your buttons shift right as a customer tries to tap them, you're failing.
The third measure is how much the page jumps around as it loads. You've felt this if you ever went to tap a button on a mobile site and the layout shifted just before your thumb landed, sending you to the wrong link. The fix is on the developer side. Your job is knowing to ask for it.
Key Takeaway
Check your site for free at <a href="https://pagespeed.web.dev/" target="_blank" rel="noopener">pagespeed.web.dev</a>. Type in your URL, run the test, look at the three scores. If any of them show up red or orange, they're costing you search ranking and sales right now.
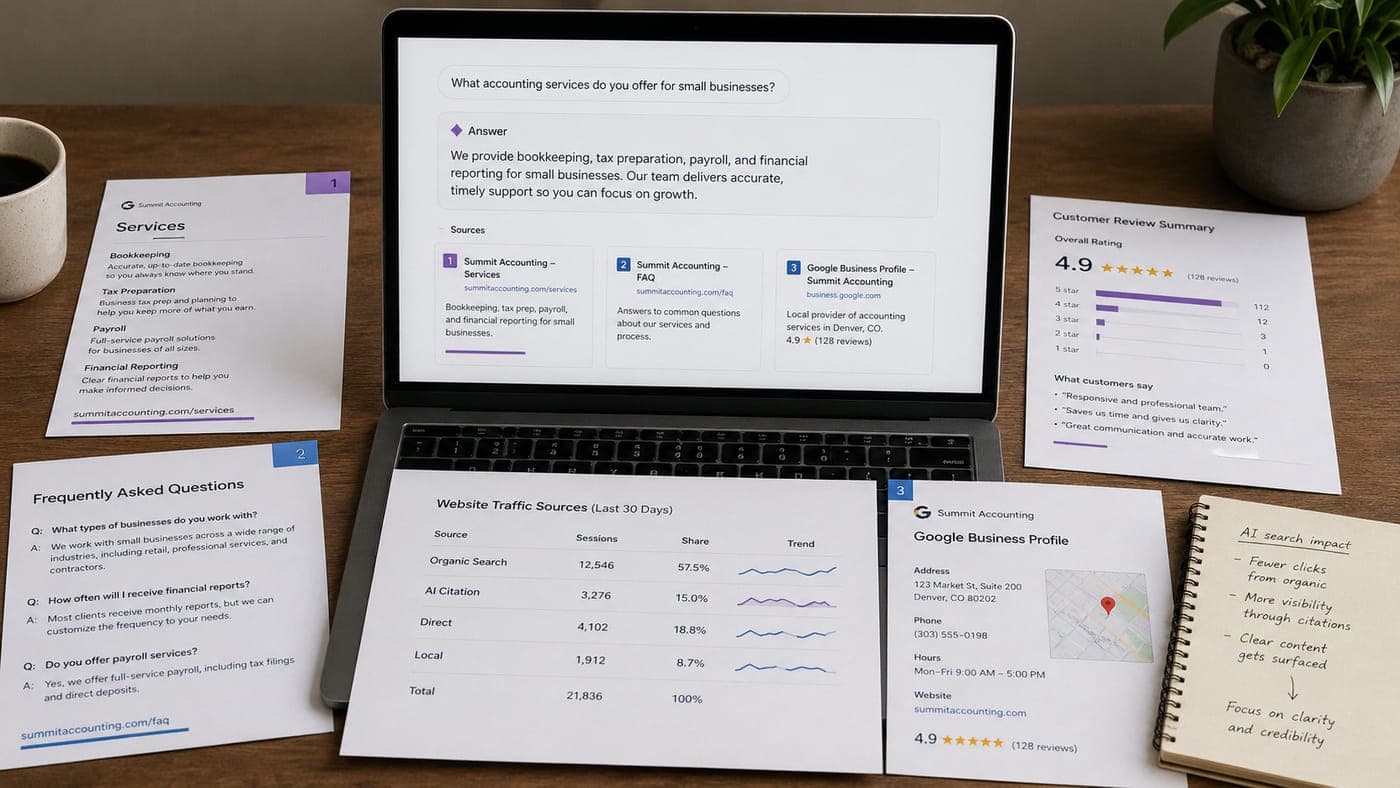
AI Search Has Split Your Traffic Sources
The biggest shift in web traffic in 2026 is AI-powered search. Google AI Overviews, ChatGPT search, Perplexity, and other AI assistants now sit between users and the web content they used to click on directly. The implications for visibility are large, and most businesses are not watching the numbers.
58%
Average click-through rate drop for the top-ranking page when a Google AI Overview is present.
AI Overviews reduce top-result clicks by up to 58% (Ahrefs, Feb 2026).
When Google displays an AI summary, click-through to everything below it drops sharply. Ahrefs' February 2026 study of 300,000 keywords found the top organic result loses up to 58 percent of its clicks when an AI Overview appears. Pew Research found users click through to a traditional result on only 8 percent of visits when an AI summary is present, down from 15 percent without. Your site can rank on page one and still get fewer visitors than it did a year ago, because the AI answered the question on the result page.
There is an upside for businesses that adapt. Websites cited inside an AI Overview become the named source of the answer. Pew found only about 1 percent of users take that click-through, so citation value is partly about visibility and recognition, not just direct traffic. The traffic that does come is pre-qualified: the user clicked after the AI endorsed your authority on the topic.
Standalone AI assistants (ChatGPT, Claude, Google AI Overview, Perplexity) still send only a tiny fraction of total web traffic. The traffic they do send behaves differently. Similarweb's analysis found that roughly one in seven visitors from ChatGPT ends up buying, compared with two or three out of a hundred from a normal Google search. The buyer shows up already sold because the AI vouched for you. The volume is small today. It's growing fast.
Being cited inside the AI summary is the new top ranking. If your site is not structured so the AI can pull answers from it, you are not in the conversation at all.
E-Commerce Benchmarks That Matter
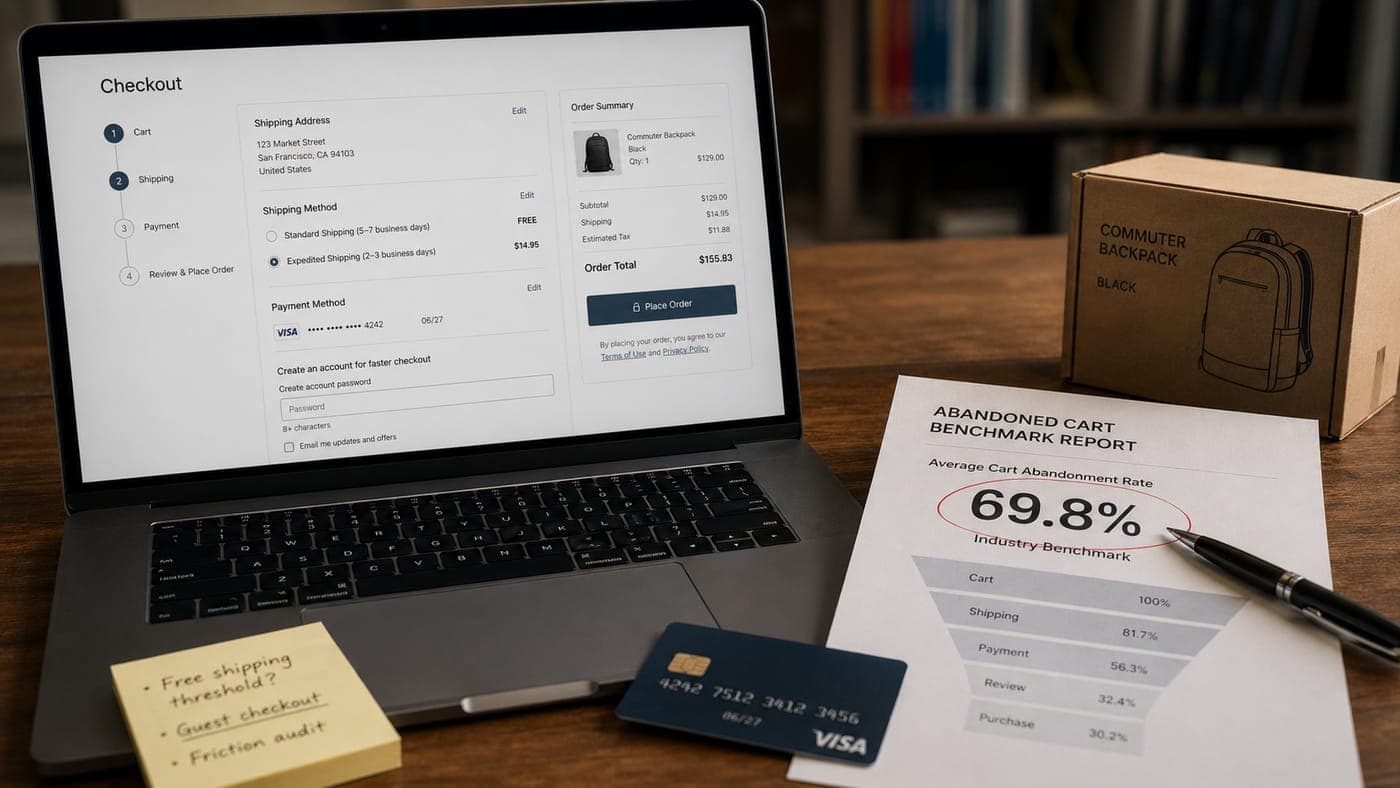
Median Shopify conversion rate sits at 1.4%. Top-tier stores convert well above 3%.
For businesses selling products or services online, the 2026 benchmark numbers cut both ways. A few of them improved. Most of the obvious friction in checkout got worse.
1.4%
Median Shopify conversion rate. Mobile is 1.2%, desktop 1.9%. The top 20% of stores convert above 3.2%.
The Littledata average has held near 1.4 percent for several years. The spread is what matters. The top decile of Shopify stores convert above 4.7 percent. The bottom quartile sits below 1 percent. The gap between the best and worst comes down to site speed, mobile experience, and checkout friction, every one of which you can actually fix.
Cart abandonment sits at 70.2 percent. Seven out of ten people who add something to their cart never complete the purchase. Baymard's aggregate data puts the top reasons in order: extra costs revealed at checkout (shipping, taxes, fees), required account creation, a checkout that takes too long or too many steps, no visible total order cost up front, and concerns about payment security. Every one of those is a design problem that has a known fix once you decide to work on it.
Key Takeaway
If your e-commerce conversion rate is below Littledata's 1.4 percent median, there is low-hanging fruit in your checkout flow. Simplifying the checkout, showing total cost up front, and offering guest checkout usually produces an immediate lift.
Local Search and Google Business Profile
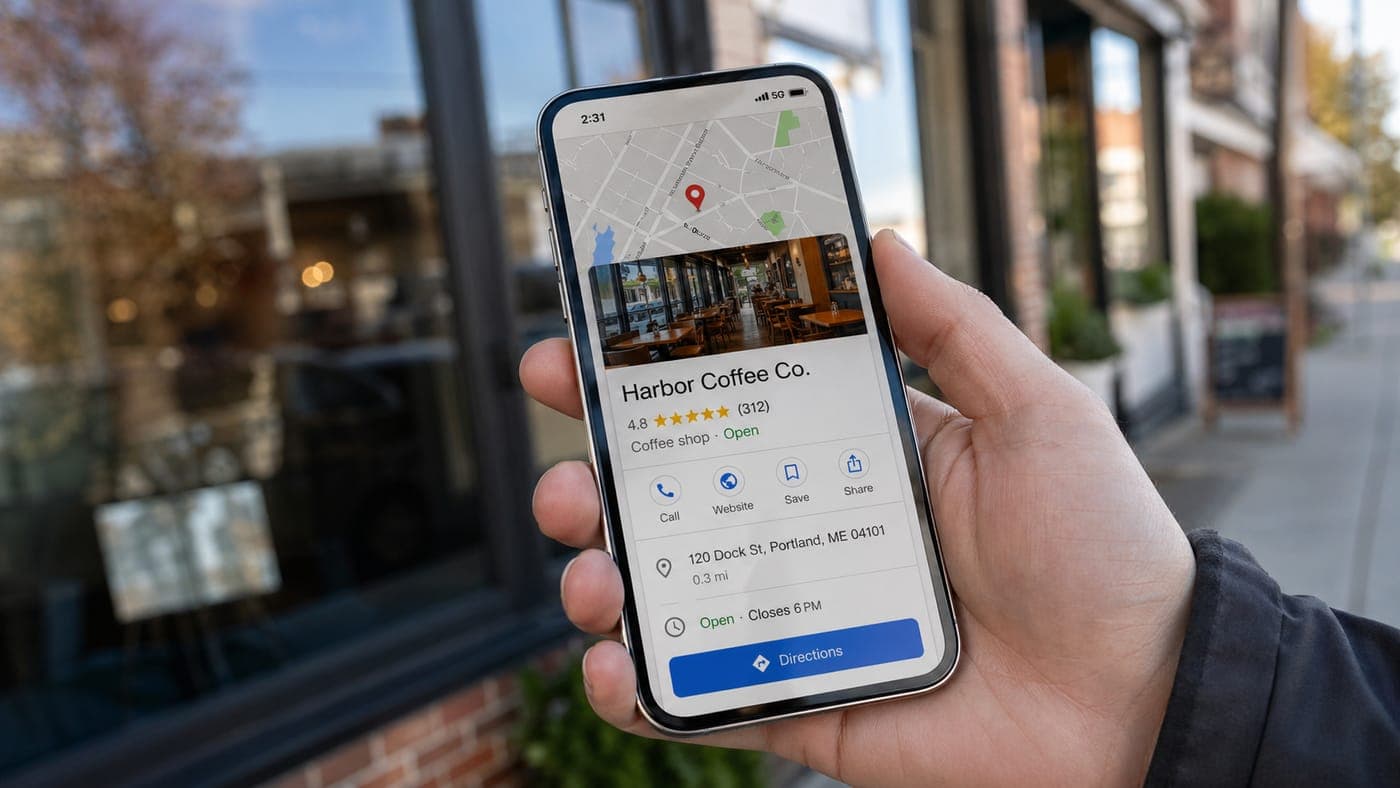
76% of local mobile searches lead to a visit within 24 hours.
76%
of people who perform a local search on their smartphone visit a related business within 24 hours.
Local search is one of the highest-intent traffic sources for any business with a location or a service area. Think with Google's data shows 76 percent of local mobile searches result in a visit within 24 hours, and 28 percent of those visits produce a purchase. When someone searches for plumber near me or web development agency Tulsa, they are ready to hire somebody today. The question is whether they hire you or the competitor one ranking above you.
Google Business Profile matters more in 2026 than a year ago because Google's AI pulls heavily from it to generate local recommendations. A complete profile with current hours, services, and reviews is the difference between being found and being skipped. It's how ChatGPT and Google AI Overview find you when a buyer in your service area is looking for the kind of work you do.
4.0
Minimum star rating before 68% of consumers rule a business out. 31% will only use businesses rated 4.5 or higher.
Review scores matter. BrightLocal's 2026 survey found 68 percent of consumers will not use a business rated below 4.0 stars, and 31 percent require 4.5 or higher. Businesses below those thresholds see a measurable drop in click-through from search results and fewer AI recommendations. Review velocity (how recently and how frequently you receive new reviews) has become increasingly important alongside total review count.
Website Accessibility Is Now a Legal and Business Imperative
5,000+
Digital accessibility lawsuits filed in 2025 — a record. Federal website-specific filings rose 27% to 3,117.
Web accessibility lawsuits keep climbing. UsableNet's year-end report counted over 5,000 digital accessibility lawsuits in 2025, a record. Seyfarth Shaw's federal-court tally shows 3,117 website-specific federal filings, a 27 percent jump over 2024. The DOJ's updated guidance confirms the ADA applies to websites and mobile apps. Small and mid-sized businesses make up a larger share of defendants each year because plaintiff firms now automate the hunt for accessibility violations.
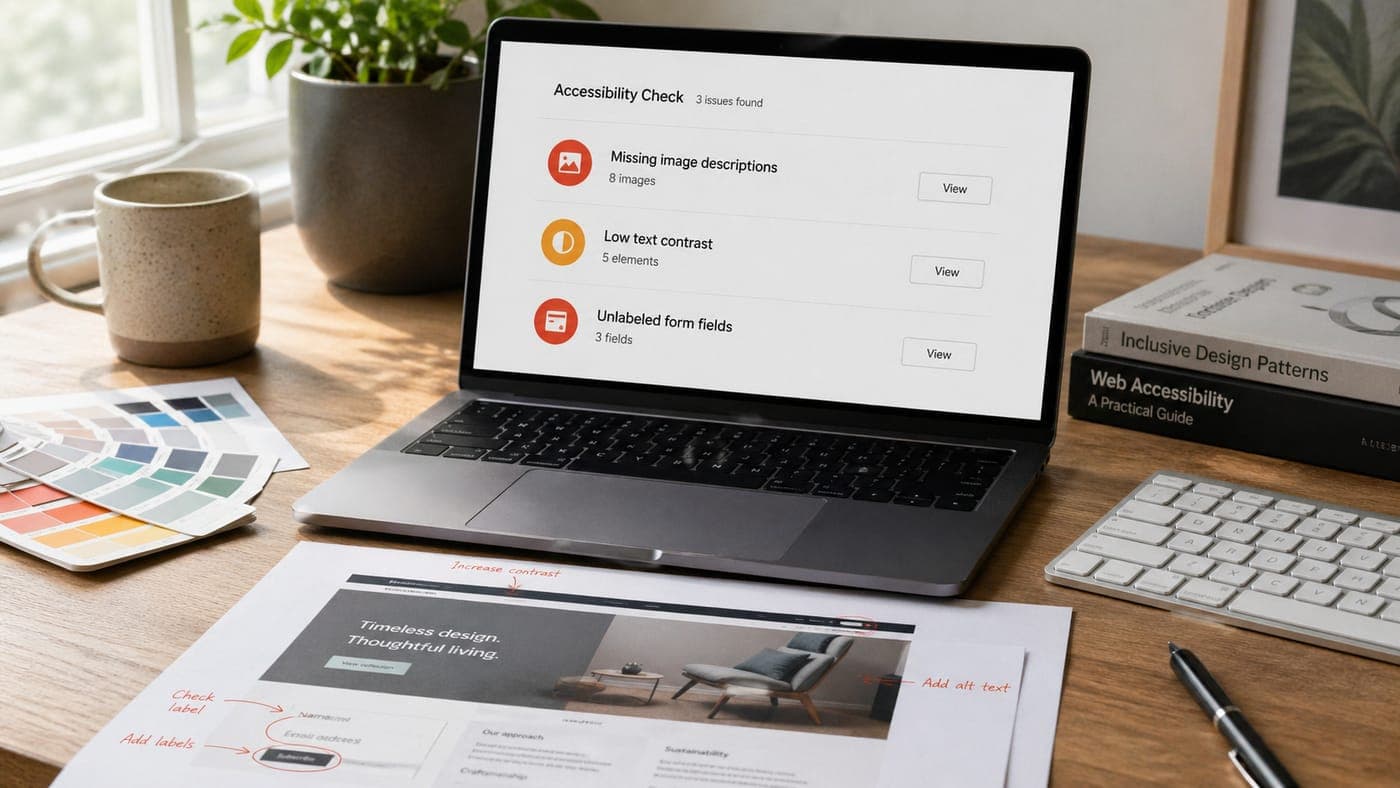
Missing alt text, low contrast, and unlabeled form fields are the top three lawsuit triggers.
The business case runs alongside the legal risk. The WHO estimates 1.3 billion people live with a disability (about 16 percent of the global population). Return on Disability estimates that community spends about 8 trillion dollars a year, or 13 trillion when you count friends and family making decisions with them. An inaccessible site locks out a huge customer base and puts you in legal crosshairs at the same time. The fix costs less than either downside.
Key Takeaway
Run a free check at <a href="https://wave.webaim.org/" target="_blank" rel="noopener">wave.webaim.org</a>. The most common lawsuit triggers are images missing descriptions for screen readers, text that's too pale against its background, and form fields that don't tell an assistive tool what goes in them. Fix those this week. They're the easiest to resolve and the ones plaintiff firms go after first.
Video and Interactive Content
82%
of marketers say video gives them a good ROI, down from 93% a year earlier.
Video on websites went from nice-to-have to expected. Wyzowl's 2026 State of Video Marketing puts the share of marketers reporting good ROI from video at 82 percent, down from 93 percent a year earlier. Unbounce's Conversion Benchmark Report found landing pages with video convert roughly 34 percent better than those without. Short-form video under 60 seconds consistently outperforms longer videos on marketing pages. Users want to see your product, team, or process quickly, not sit through a three-minute corporate overview.
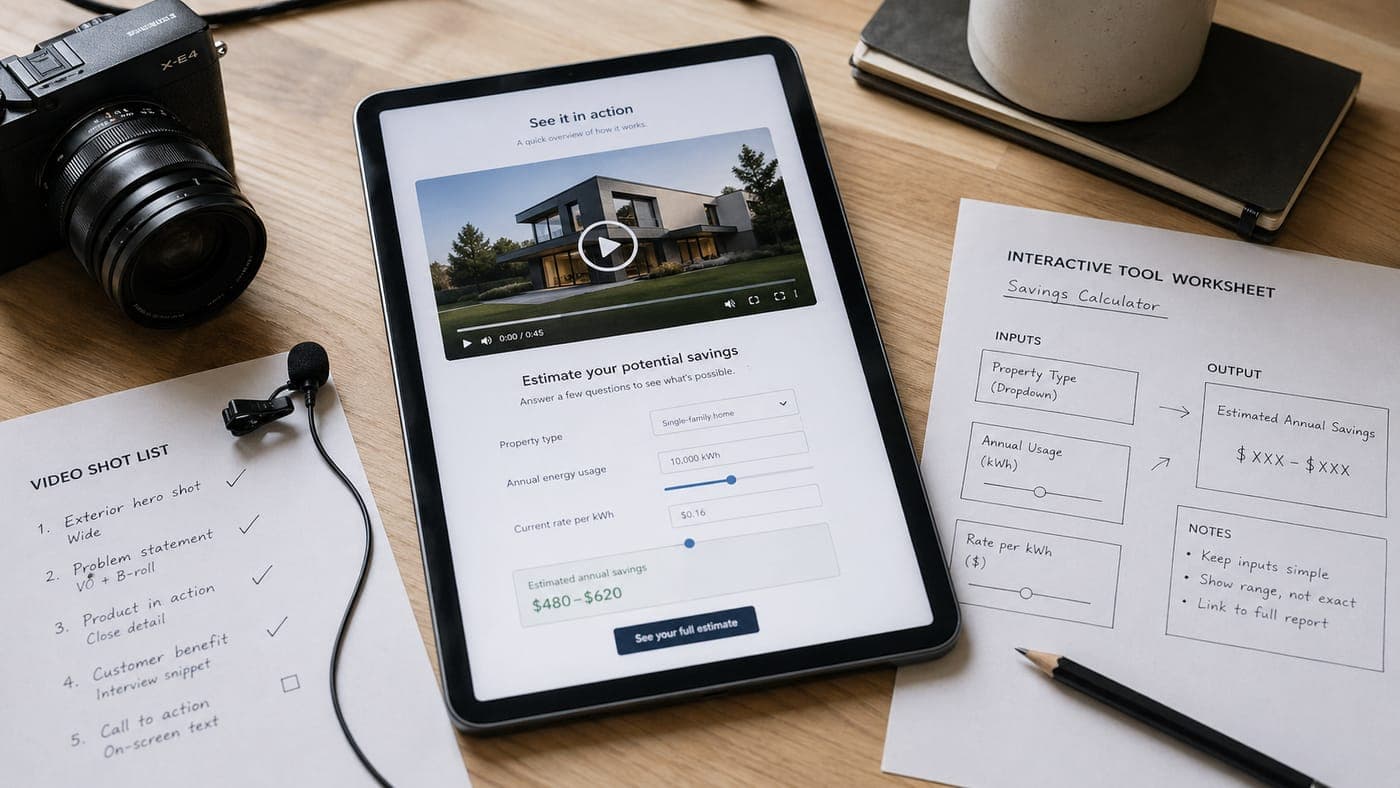
Pages with video convert ~34% better. Interactive tools keep visitors on the site longer.
Interactive content (calculators, configurators, quizzes, assessment tools) keeps people on your site longer and turns more of them into buyers than a static page does. If you sell something complex (equipment, a service with tiers, a custom build), a tool that lets a visitor check pricing, compare options, or figure out what they need is one of the best-selling pages you can have.
What To Do With These Numbers
None of these numbers matter unless you do something with them. Before you change anything, benchmark where you actually stand. Run pagespeed.web.dev on your main pages, open the site on an actual phone and walk through it the way a customer would, and pull your conversion rates from analytics. You need to know where you are before you spend money to move the number.
Prioritize by impact. If your site takes six seconds to load on mobile, that is the fix that has to happen before anything else. Content, ads, SEO. They are all undermined by a slow site. If the site is already fast but your forms are long and complex, that is next. Work from the foundation up.
Do not try to do everything at once. Pick the two or three metrics furthest below benchmark for your industry and focus there. A 10 percent improvement in your weakest area will produce more results than a 2 percent improvement across the board. The data above gives you the benchmarks. The next step is measuring yourself against them and building a plan.
A 10 percent improvement in your worst number will beat a 2 percent improvement across the board. Fix what's furthest from the benchmark first.
Key Takeaway
The gap between businesses with optimized sites and those running on outdated ones is bigger in 2026 than it has been in the last decade. Every statistic above points at the same conclusion. Invest in your website like the revenue-generating asset it is, or watch the competitor across town pick up the customers you left on the table.
Ready to harness AI for your business?
Let's Build Something
That Actually Works
We've been building websites for 25+ years. Now we build them with AI. Faster, smarter, and more capable than ever.
Free consultation · No obligation · Real humans (augmented by AI)